IEA World Energy Outlook 2025
My conclusions from two charts
I took a look at the IEA World Energy Outlook 2025 which was recently published.
The authors do three what-if scenarios, with the policies of the world’s governments as the largest variable.
I want to share a couple of graphs that I feel contradict the position of our US government when I hear Secretary Wright say that our future is natural gas, nuclear, and clean coal. Trump is a bit of a miracle worker but he has his work cut out for him this time.
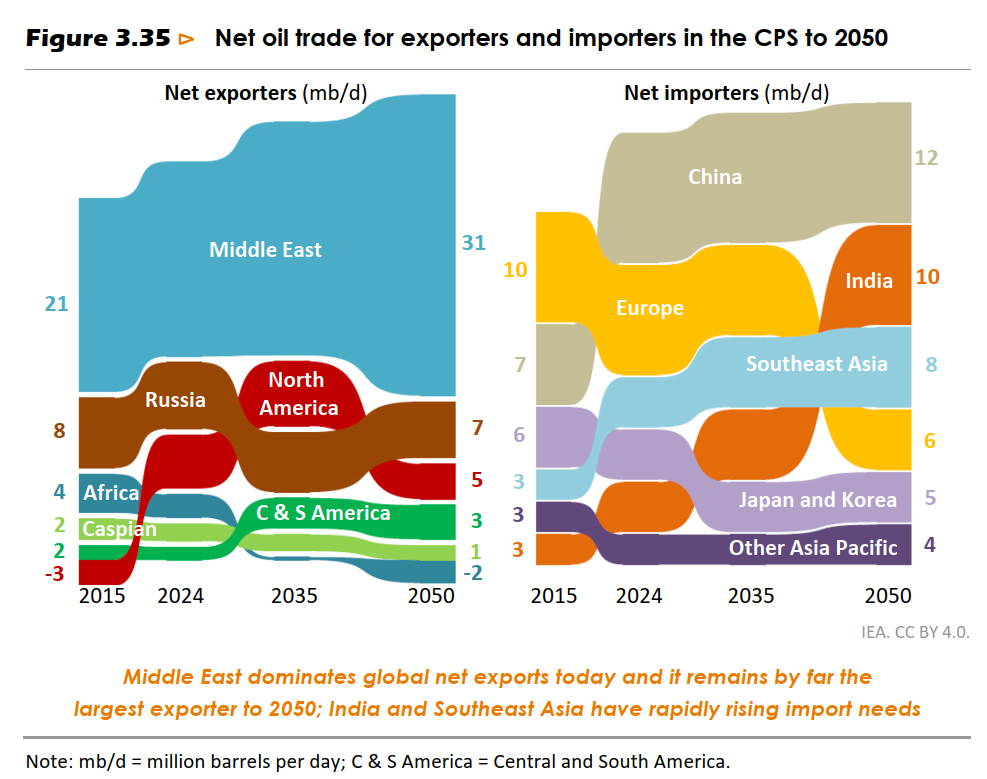
The first graph shows that the oil business is not much of a growth business. We can drill, baby, drill, but we can’t sell, baby, sell, at least not in a dramatic way. The limiting factor is the customers, not the supply. Demand goes up until the graph ends in 2050 but there is no sustained upward curve. This scenario, called CPS for Current Policy Scenario, is the one with the least new government interventions in the market.
The Middle East is the region that shows significant growth and will be the recipient of a significant flow of money, which leads to more influence on world politics. China and India are the main buyers. So the action in the oil business will be between the Middle East as supplier and China and India as the buyers. The US will have a minor role in the international oil trade, just as we do now.
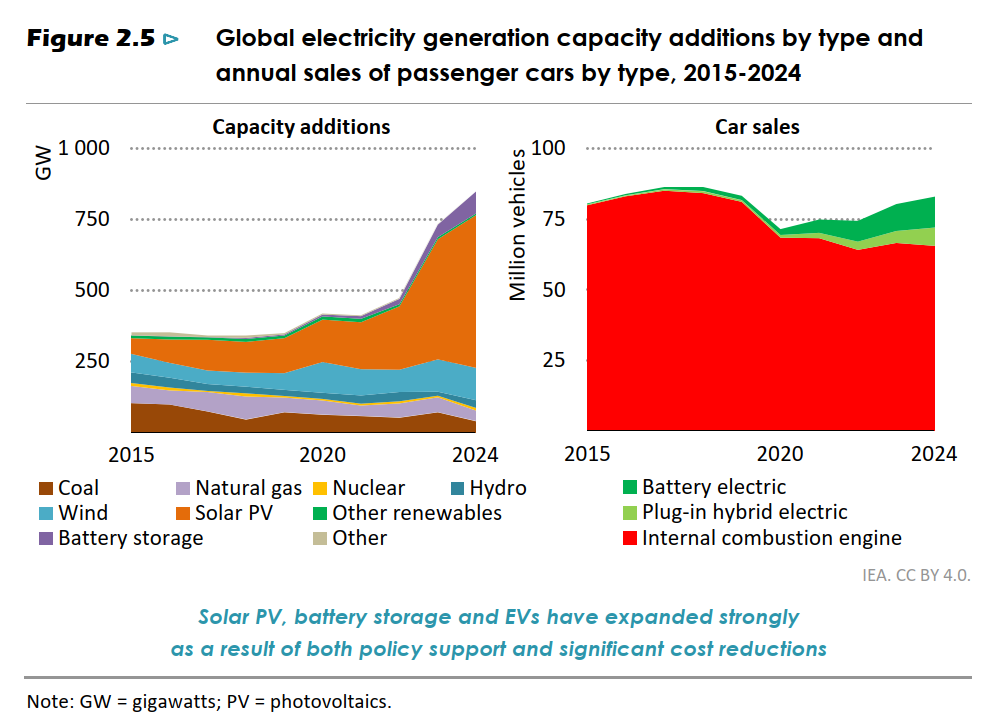
The second graph is history and not a projection. The left panel shows that it was the case in 2015 that additions to the world’s electricity supply had contributions from solar and natural gas in about the same quantity. In 2024 the solar, wind, and batteries have grown to be almost everything that is going on. Nuclear has been a minor player in adding to capacity and things will have to change greatly for it to become a major growth player. The legend shows the names of the color bands, where the names are listed left to right to match with colors on the graph from bottom to top.
For perspective, a standard $10 billion nuclear plant is rated at 1 GW. It is an apples-to-oranges comparison between nuclear and solar GW but when comparing them on energy output, GWh, instead of power output, GW, it takes about 5 GW of solar to make the same GWh energy as 1 GW of nuclear. Apparently the market is OK with that.
The right panel shows the worldwide ICE car production numbers as slowly dropping. The growth segment is EVs. This is the mix of drive trains for the world, not the US. The US is a minor player in the EV market to begin with, and our increase in EV percentage is lower than the world.
Here is a link to the full report.