
New York's electricity emergencies. How can supply and demand match?
Explain it to your neighbors, New Yorkers
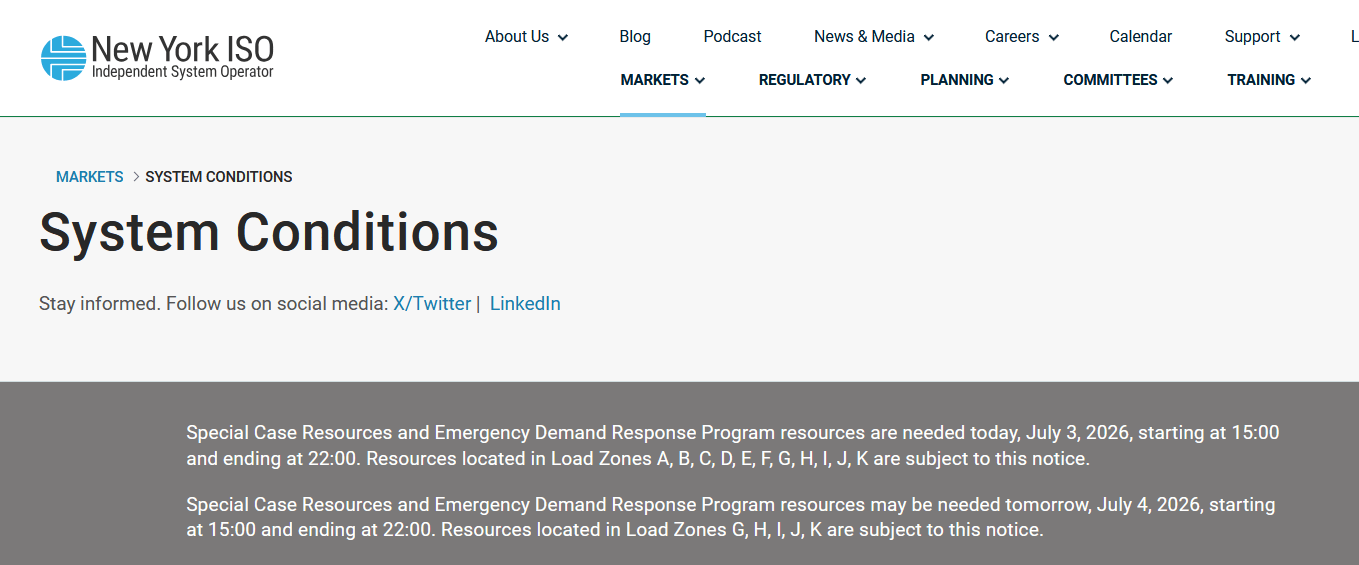
New York’s electricity supply is in the news.
This article discusses how demand is reduced when necessary and how new sources of supply are being used to limit the times demand must be reduced.
The grid operator in New York State is an Independent System Operator named New York ISO. Its homepage is nyiso.com
Voluntary curtailments
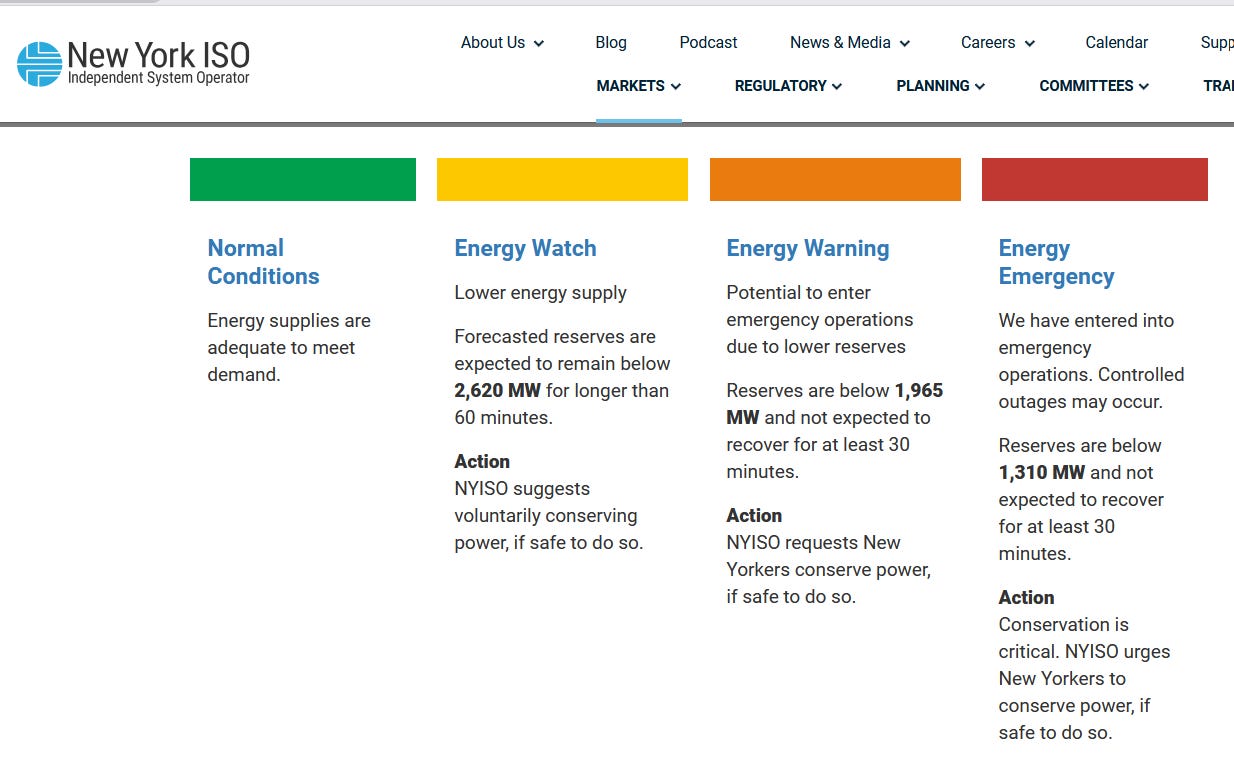
The New York ISO warning system has four color-coded levels. The statement about curtailment requests from the general public all end with the statement “if safe to do so.” None are mandatory.
Contract Demand Response
Some large customers have signed contracts saying they will reduce their load for a few hours when requested to do so by New York ISO. These programs are common across the country. Participants are rewarded with cash payments or other compensation. Many factories, office buildings, and shopping malls have ways to draw less power for a few hours and their business functions are not interrupted. Typically the contract says an individual customer will only be asked to curtail demand once per year.
Supply and Demand on July 2, 2026
New York ISO has a dashboard where you can see the fuel mix of the electricity flowing through the grid.
The following charts show all fuels, fossil fuels alone, nuclear alone, hydro alone, and wind plus other together.
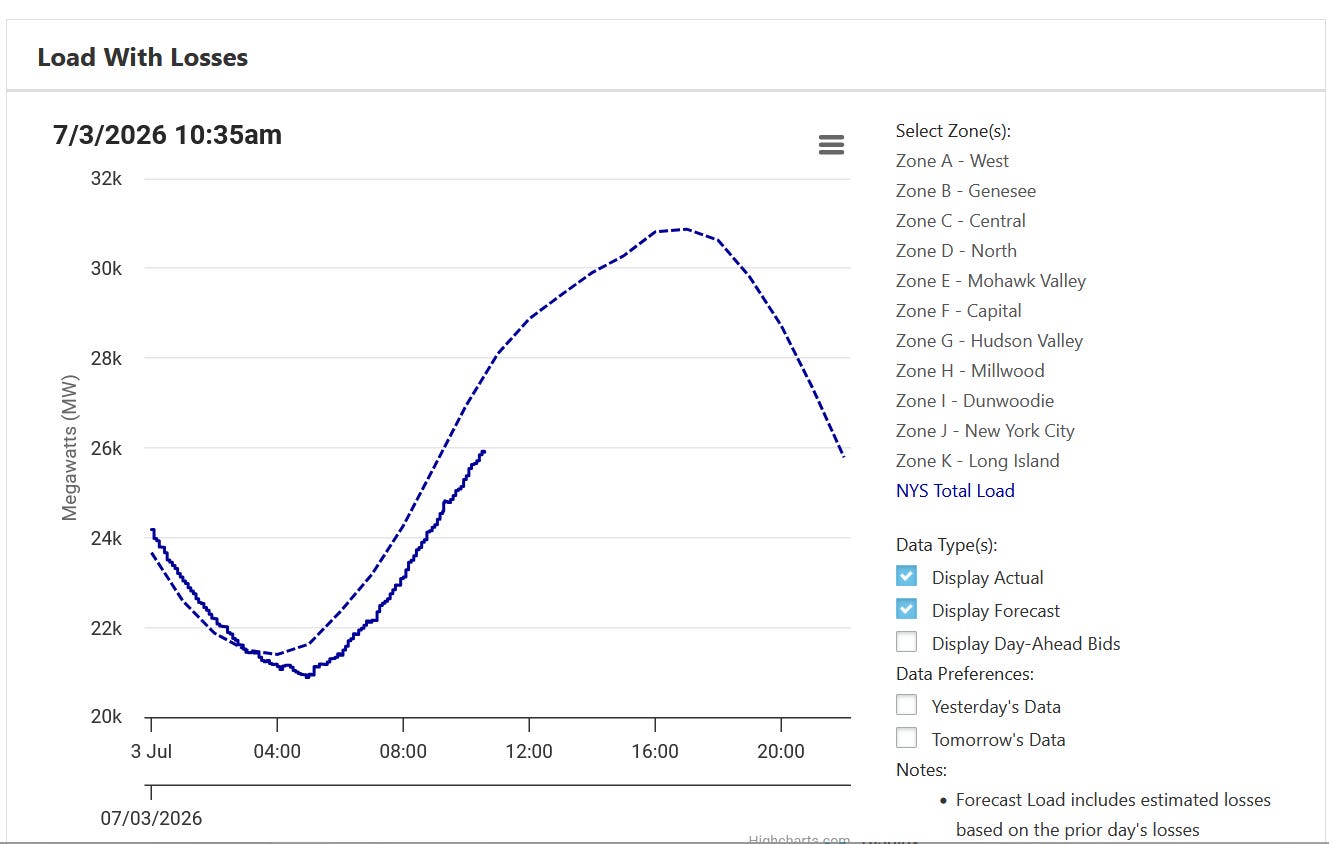
Demand
The late afternoon period with demand above 30,000 MW on July 3, 2026, is predicted to be 2 pm to 7 pm. July 2 was similar.
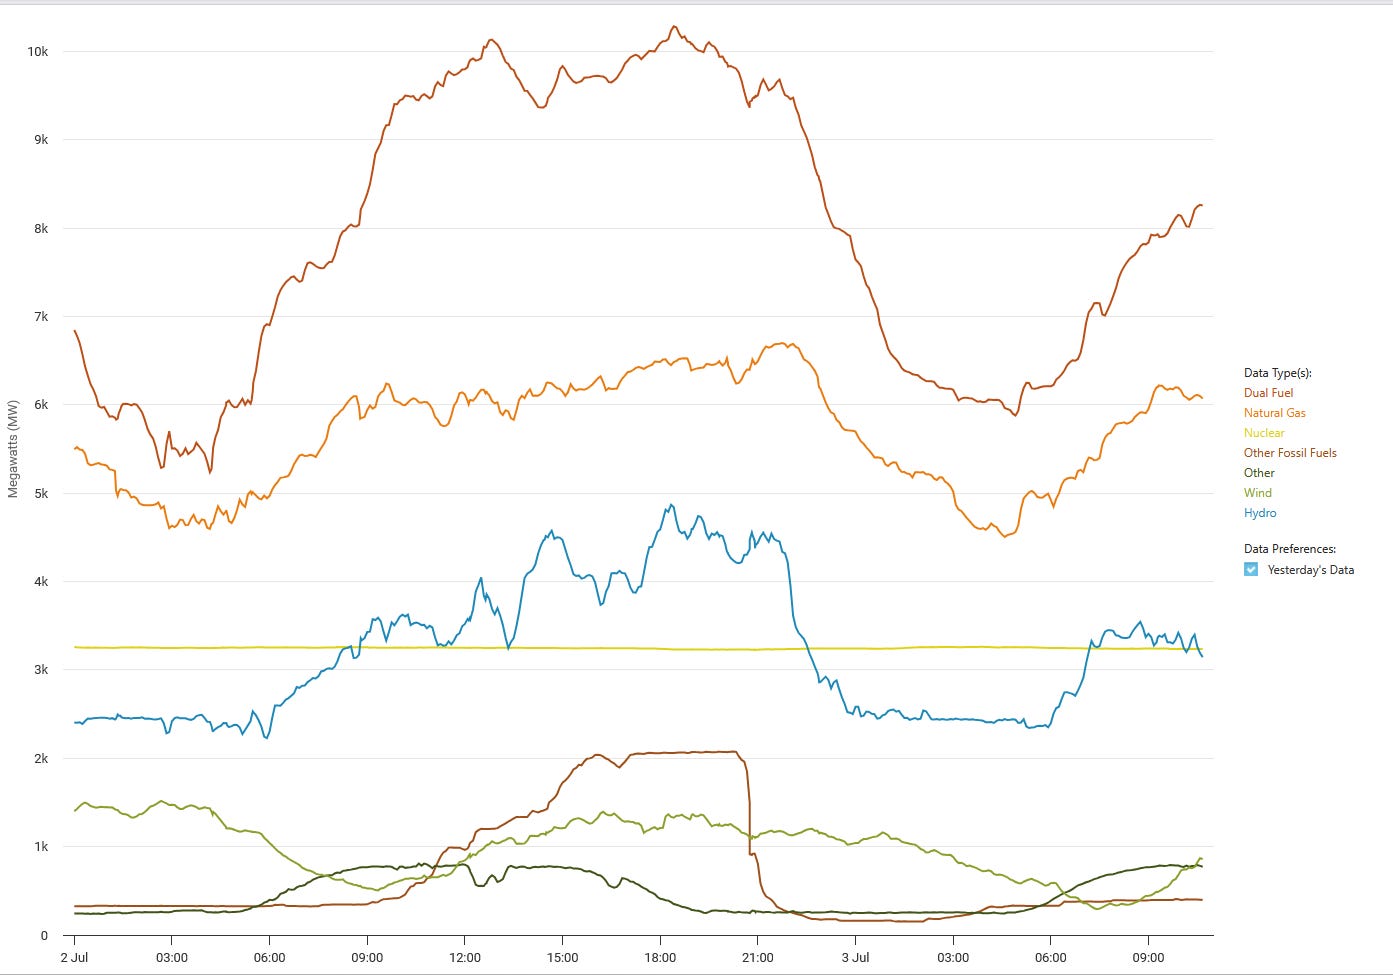
Supply
The chart for supply shows seven categories. The time period on the X-axis is the 24 hours of July 2 and the morning hours of July 3. Thousands of MW are shown on the Y-axis.
The Northeast has a power plant type that is not common elsewhere, Dual Fuel. The two fuels are typically fuel oil and natural gas. New York ISO measures the input MW to its grid but does not have knowledge of the fuel by dual-fuel plants.
The category Other Fossil Fuels includes coal.
Wind has its own category but Solar does not. Solar is inside the Other category.
All fuels
The all-fuels chart shows each fuel individually. The total is not shown. During the 2 pm to 7 pm peak all fuels but nuclear are making a higher contribution than at other hours.
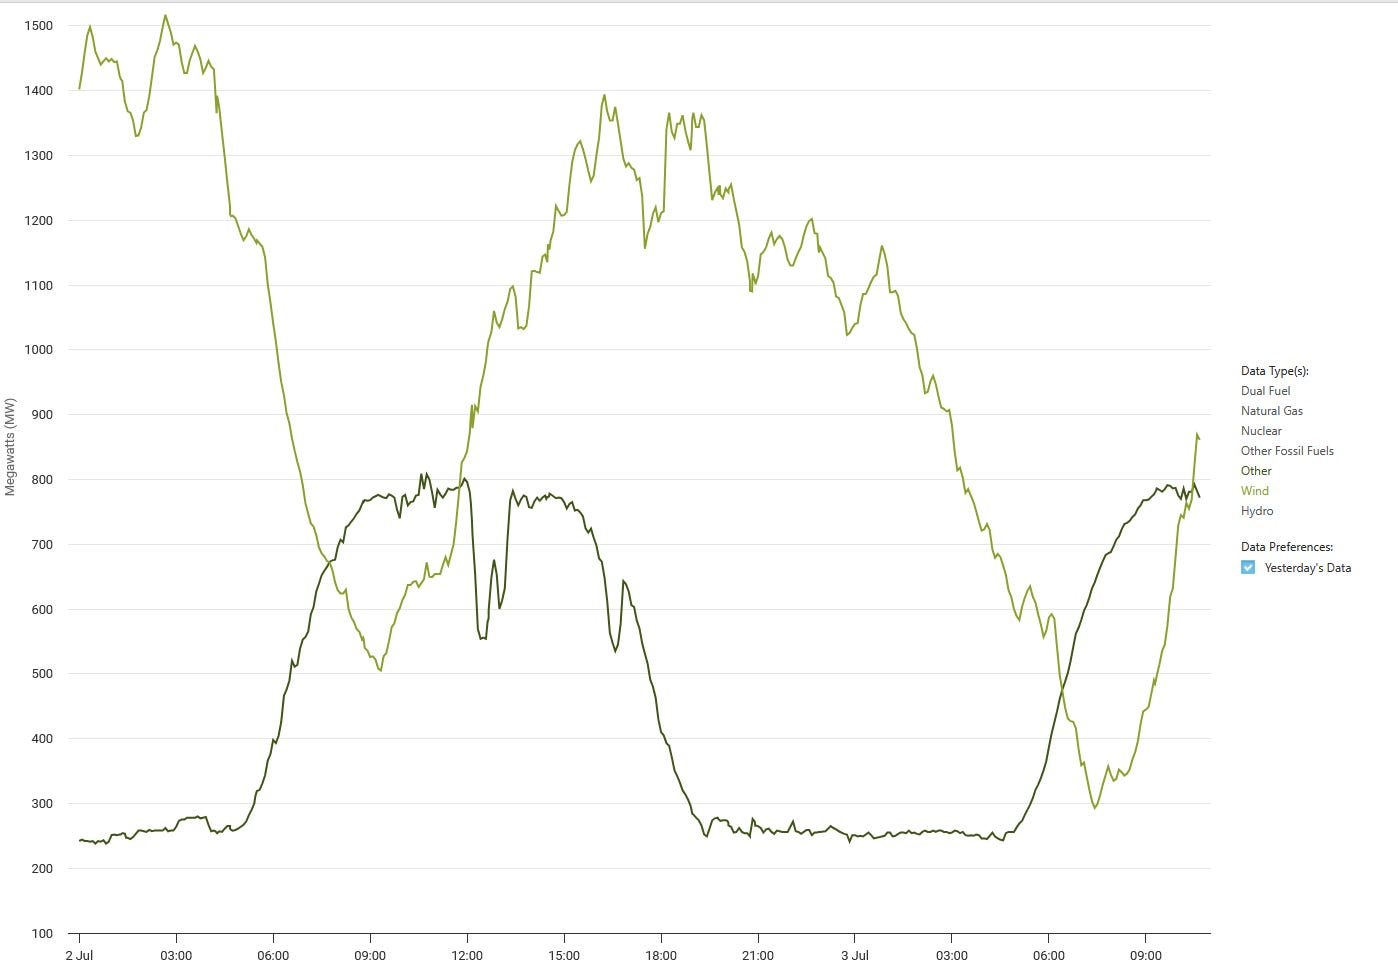
Wind and Solar alone
The contribution of wind and solar are dependent on the weather but on July 2 their contribution during the peak 2 pm to 7 pm period was about 2,000 MW the entire time, or about 7% of the total MW handled by New York ISO.
During the peak 5 hours, wind and solar took 2 MW of load off the other sources, saving energy and reducing risk of a shortfall on the grid. Summer days are long in New York City,with sunrise at 5:30 am and sundown at 8:30 pm.
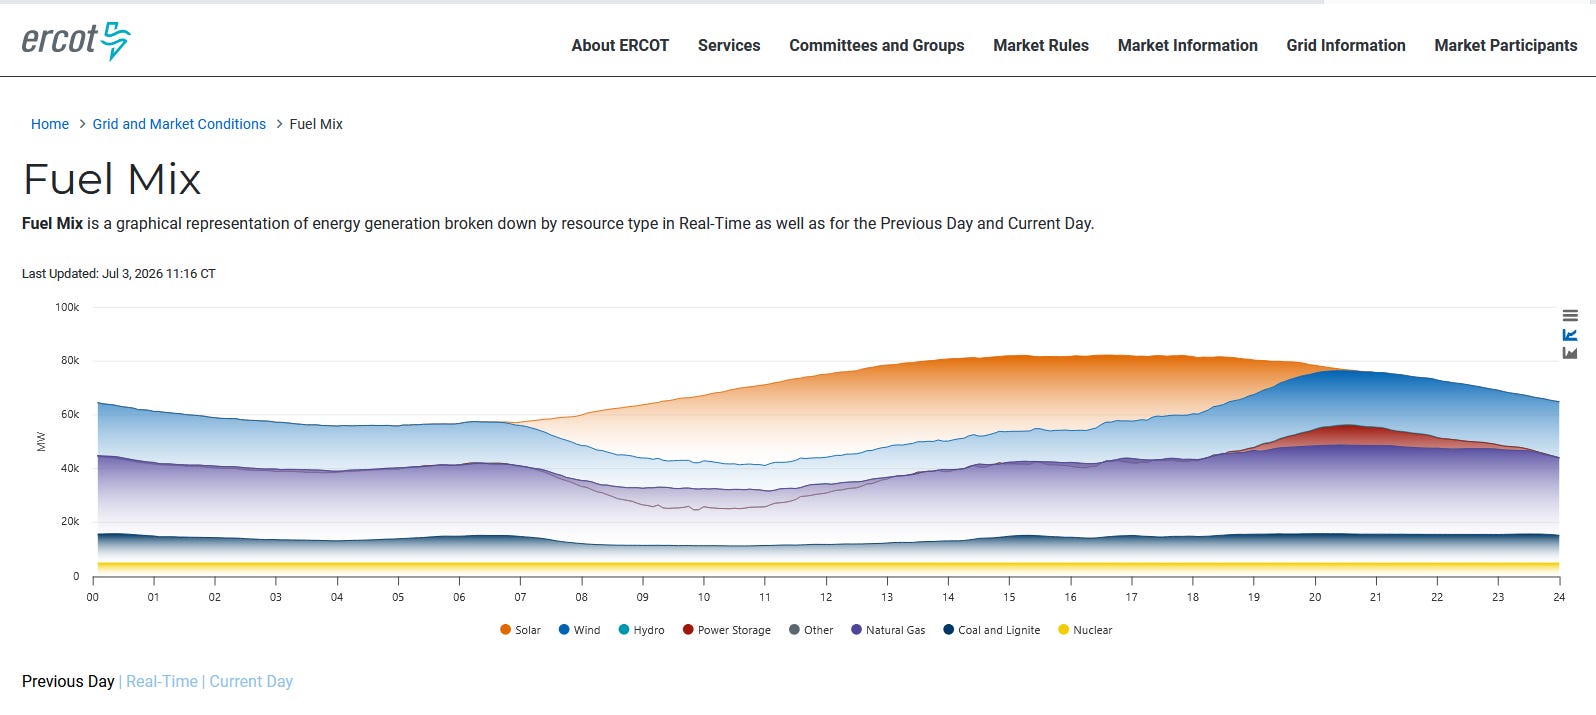
July 2 in ERCOT, for comparison
Other grids have far more solar and wind resources available, ERCOT in Texas for example.
On July 2, 2026 in ERCOT the combined power in MW was between 15,000 MW and 40,000 MW. Their contribution was between 26% and 48% all 24 hours.
Conclusion
Solar and wind are criticized as not dispatchable and not making a contribution on cold winter mornings. Those characteristics are both true.
Solar-sourced energy is most available on summer afternoons, coinciding with peak demand on summer days.
Wind-sourced energy is most available at night, and more during the spring and fall.
When New York ISO added solar and wind the number of sources available to the grid operators went up from five to seven. In any time of shortages in delivered fuels the solar and wind resources add two more incoming energy streams in solar photons and the kinetic energy of the wind.
Solar- and wind-sourced electricity are tools for reducing risks and saving fuel.
Tag: Emergencies